Mold grows on bread when fungal spores already present in the air or on surfaces land on the bread and find the right combination of moisture, warmth, nutrients, and oxygen to germinate. In everyday environments, microbes can grow on surfaces like bread, skin, and countertops, so good hygiene and proper food storage help limit unwanted colonization. For a simple class-7 explanation of the process, see how fungi grow on bread class 7. Within 24 to 48 hours under ideal conditions (around 25–30 °C and high humidity), a single spore extends a thread-like hypha, branches repeatedly into a mesh called mycelium, and produces visible fuzzy colonies within three to seven days. This science project recreates those conditions in a controlled way so you can observe, measure, and explain exactly why mold thrives or stalls depending on the environment you give it.
How Does Mold Grow on Bread: Classroom Science Project

Project overview and what you'll learn
This project is designed for middle- and high-school students (roughly grades 6–12) and aligns with Next Generation Science Standards (NGSS) practices including asking questions, planning investigations, analyzing data, and constructing explanations. The central scientific question is: which environmental conditions speed up or slow down mold growth on bread? By systematically changing one variable at a time, you will build real evidence for principles that food scientists, public health professionals, and microbiologists use every day.
- Explain the life cycle of a bread mold fungus, from spore to visible colony.
- Identify the key environmental requirements for fungal growth and describe how each one affects growth rate.
- Design a fair test with clearly defined variables and appropriate controls.
- Collect, record, and graph quantitative and qualitative data over time.
- Interpret results and connect them to real-world applications in food safety and food preservation.
- Handle microbial cultures safely and dispose of materials responsibly.
What bread mold actually is (and how it differs from bacteria)
Bread molds are fungi, not bacteria, and that distinction matters for understanding how they grow. See a list of common substrates that fungi can grow on for examples and details. Fungi are eukaryotic organisms, meaning their cells contain a membrane-bound nucleus and complex organelles, similar to plant or animal cells. Bacteria, by contrast, are prokaryotic: no nucleus, no membrane-bound organelles, and a cell wall built from a polymer called peptidoglycan. Fungal cell walls are made largely of chitin, the same tough material found in insect exoskeletons. This difference in cell architecture is why some antibiotics that target bacteria have no effect on fungal infections, and it explains why the two groups respond differently to temperature, pH, and chemical preservatives.
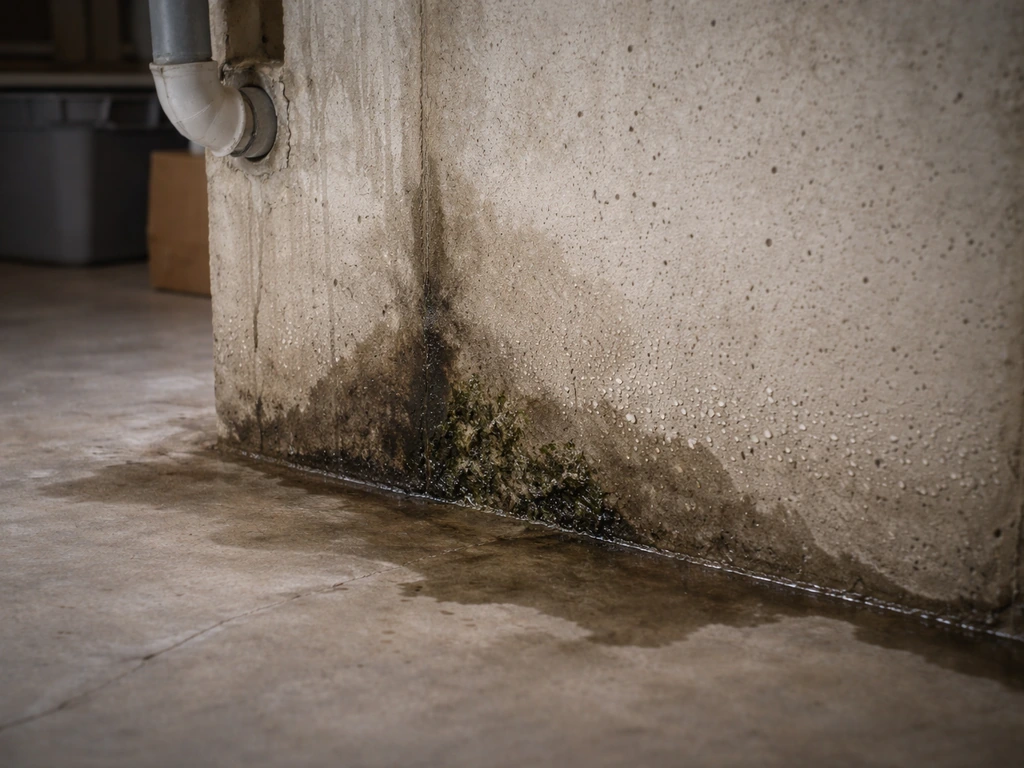
Structurally, a mold does not exist as single isolated cells the way many bacteria do. It grows as long branching filaments called hyphae (singular: hypha). Fungi are eukaryotic organisms that absorb nutrients through their cell walls, grow as filamentous hyphae that form a mycelium, reproduce by producing spores (sexual and/or asexual), and commonly have chitin in their cell walls blank" rel="noopener noreferrer">Fungi are eukaryotic organisms that absorb nutrients through their cell walls, grow as filamentous hyphae that form a mycelium, reproduce by producing spores (sexual and/or asexual), and commonly have chitin in their cell walls.. As hyphae extend and interweave, they form a dense mat called mycelium, which is the fuzzy visible growth you see on old bread. The mycelium absorbs nutrients directly through its walls, secreting digestive enzymes outward to break down the bread's starch, protein, and fats before drawing the resulting simple molecules back in. When conditions become crowded or resources run low, the mold shifts to reproduction, producing specialized structures that generate enormous numbers of spores. Those spores are microscopic, lightweight, and nearly everywhere in normal indoor air, which is exactly why bread left out goes moldy without you ever deliberately adding anything to it. For related guidance on how mold grows indoors and practical steps to prevent and remediate household infestations, see how does mold grow in basement.
The life cycle moves in a predictable sequence: spore landing on substrate → spore germinates and sends out a germ tube → germ tube elongates into hyphae → hyphae branch and form mycelium → reproductive structures develop → new spores are released. Under a low-power microscope you can observe each of these stages at different time points in your experiment.
Common bread mold species and how to tell them apart
Three genera dominate bread spoilage in homes and bakeries: Rhizopus, Penicillium, and Aspergillus. Knowing which one you are likely seeing helps you interpret your experimental observations accurately.
| Genus | Common name | Color of colony | Texture | Optimal growth temp. | Notable feature |
|---|---|---|---|---|---|
| Rhizopus (e.g., R. stolonifer) | Black bread mold | White cottony mycelium, dark sporangia | Fluffy/cottony | ~25–30 °C | Non-septate hyphae; very fast-spreading; first mold to appear on moist bread |
| Penicillium (e.g., P. expansum) | Blue/green mold | Blue-green to grey-green powder | Powdery | ~20–25 °C | Brush-like conidiophores; slow start but heavy sporulation; may produce patulin mycotoxin |
| Aspergillus (e.g., A. niger, A. flavus) | Black/yellow mold | Black, green, or yellow depending on species | Powdery to granular | ~25–35 °C (some to 37 °C+) | Thermotolerant; some strains produce aflatoxins or ochratoxin A |
In a classroom experiment using naturally contaminated bread (no deliberate inoculation), Rhizopus stolonifer is typically the first colonizer you see because it grows very rapidly on moist bread at room temperature and its large, visually dramatic dark sporangia are unmistakable. Penicillium tends to appear on drier or refrigerated samples and grows more slowly but eventually produces that characteristic blue-green powder. Understanding which species you are likely working with also informs your safety precautions, covered later in this article.
The six conditions that control mold growth
No single factor drives mold growth in isolation. Temperature, moisture, oxygen, pH, nutrients, and light all interact, and changing any one of them shifts the balance between vigorous growth, slow growth, or dormancy. Think of each factor as a dial on a control panel: turn them all into the favorable range and you get rapid colonization; push even one dial too far in the wrong direction and growth slows or stops entirely. This is exactly the principle your experiment exploits.
Temperature
Most bread molds have an optimal growth range between about 20 and 30 °C. Rhizopus stolonifer grows fastest at roughly 25–30 °C, while Penicillium species prefer slightly cooler conditions near 20–25 °C. Aspergillus flavus and related species are notably thermotolerant and can grow at 37 °C or above, which is also human body temperature. Below about 4 °C (standard refrigerator temperature), fungal metabolism slows dramatically, explaining why refrigeration extends shelf life. Freezing halts visible growth altogether by immobilizing the water mold needs for enzymatic activity. Above roughly 60 °C, proteins in fungal cells denature and the organism dies, which is why baking kills mold already present in dough even though the baked loaf is immediately vulnerable to airborne spores once it cools.
Moisture and water activity
Water availability is arguably the most important single variable for mold on bread. Food scientists express this as water activity (aw), a scale from 0 (bone dry) to 1.0 (pure water). Fresh baked bread typically has an aw between about 0.94 and 0.97, comfortably above the threshold most bread molds need. Many common food molds can grow down to aw values of roughly 0.78–0.84 (true of some xerophilic Aspergillus strains), but Rhizopus and most Penicillium species on fresh bread prefer conditions above aw 0.90. Adding water to bread samples in your experiment or sealing them in a humid container dramatically accelerates colonization; drying bread or exposing it to low-humidity air slows it. This also explains why toasting or oven-drying bread slows spoilage: you are removing available water, not just applying heat.
Oxygen
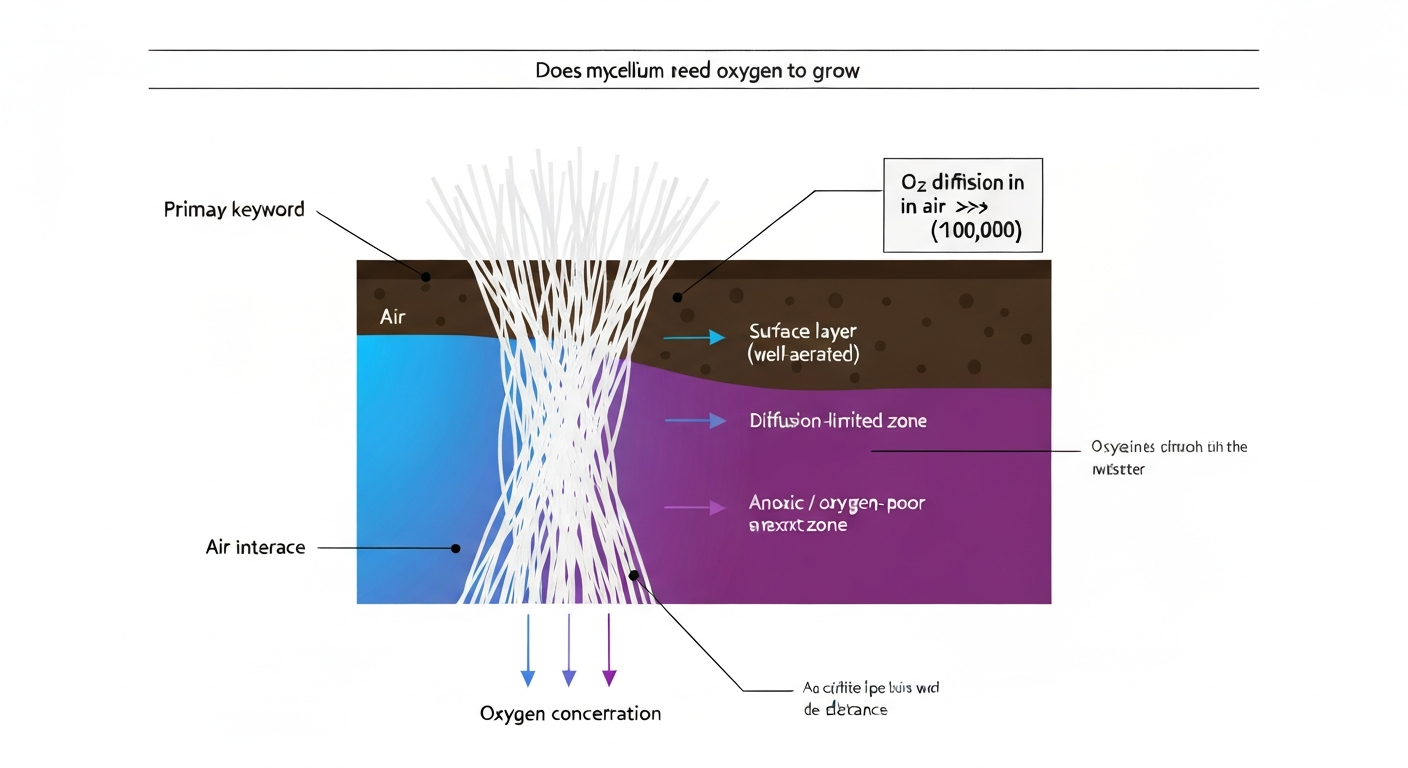
Molds are aerobic organisms: they require oxygen for their metabolic processes and for sporulation. This is one key difference from many bacteria, which include anaerobic and facultatively anaerobic species that can grow without any oxygen at all. In practice, it means sealing bread in an oxygen-depleted environment significantly slows mold growth. Commercial modified-atmosphere packaging (MAP) for bakery products works precisely on this principle, replacing oxygen with carbon dioxide or nitrogen to extend mold-free shelf life. In your experiment, comparing sealed plastic bags (where oxygen is initially present but limited) with open bread samples tests this variable directly.
pH
Bread is mildly acidic to near-neutral in pH, typically around 5.3–6.2 depending on the recipe. Most bread-spoilage molds tolerate a fairly broad pH range (roughly 3–8) and are not as pH-sensitive as many bacteria. However, strongly acidic conditions do slow fungal growth, which is why sourdough bread (pH often 3.8–4.5 due to lactic acid and acetic acid from fermentation) stays mold-free significantly longer than commercially yeasted white bread. For your experiment, testing bread treated with a small amount of dilute acid solution (or comparing sourdough versus white bread) lets you observe pH effects directly.
Nutrients
Bread is essentially a rich fungal buffet. It provides readily available carbohydrates (starch and sugars), proteins, lipids, and minerals. Molds secrete enzymes (amylases, proteases, lipases) into the bread to pre-digest these macronutrients externally before absorbing the simpler breakdown products. This is why moldy bread develops soft, discolored patches: the mycelium is literally digesting the surrounding substrate. Comparing different bread types (white, whole wheat, rye, sourdough) in your experiment also tests nutrient availability because whole-grain breads offer more complex carbohydrates and minerals, which can influence growth rate and species composition.
Light
Light's role in mold growth is more nuanced than most classroom resources acknowledge. Continuous light or specific light wavelengths can inhibit or stimulate sporulation and pigment production in ways that vary by species and strain. Generally, light does not directly kill mold the way UV radiation in large doses might, but dark incubation tends to produce more consistent mycelial growth in classroom experiments. A simple variation for your experiment is to incubate identical bread samples in a dark cupboard versus on a sunlit windowsill and compare not just growth rate but colony color and spore production.
Forming a good hypothesis
A strong hypothesis for this experiment does two things: it makes a specific, testable prediction, and it states the biological reason behind that prediction. Avoid vague hypotheses like 'mold will grow faster in warm conditions.' Instead, connect the mechanism to the outcome. For example: 'If bread samples are incubated at 28 °C rather than 4 °C, then mold colonies will cover a greater percentage of the bread surface within seven days, because fungal enzymes and metabolic processes operate at higher rates within the optimal temperature range of common bread-spoilage molds.' That structure (if... then... because...) forces you to articulate the causal mechanism, which is the actual science. Before finalizing your hypothesis, review the background on each environmental variable, decide which single variable you want to test, and make sure you can realistically measure the outcome.
Materials and equipment
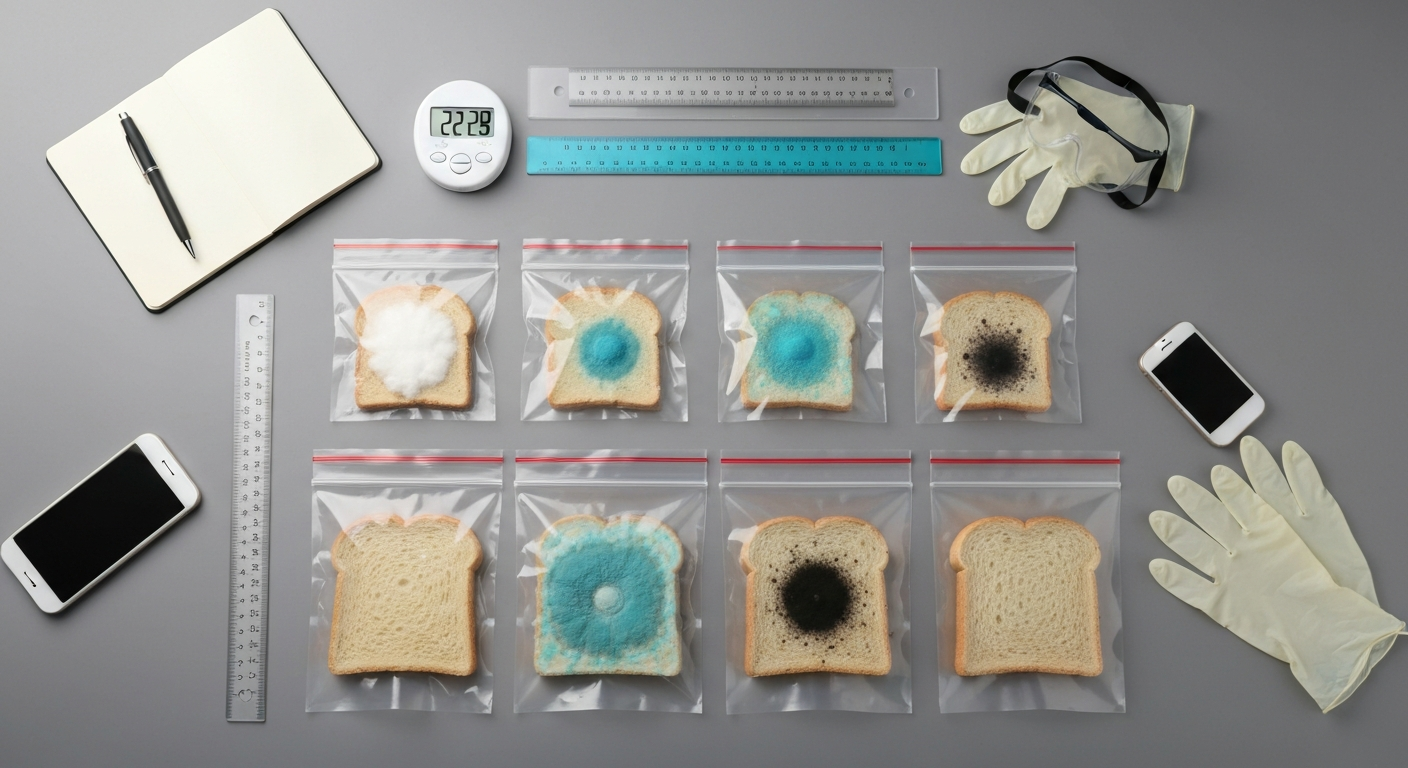
All materials for this experiment are classroom-safe, widely available, and inexpensive. Avoid collecting mold samples from walls or soil for deliberate inoculation; the naturally occurring spores already on and around store-bought bread are entirely sufficient to produce visible growth without introducing unknown organisms.
- Sliced bread (white sandwich bread works well as a standard substrate; buy additional types if testing bread variation)
- Resealable clear plastic zip-lock bags (sandwich or quart size), one per sample
- Permanent marker and adhesive labels for labeling
- Clean spray bottle filled with distilled or tap water
- Ruler (metric, millimeter markings preferred)
- Digital camera or smartphone for photographic documentation
- Graph paper or access to spreadsheet software (Google Sheets or Excel)
- Nitrile or latex gloves (one pair per student per handling session)
- Safety glasses or goggles
- A fridge and a space at room temperature (~20–22 °C) or a warm location (~28–30 °C) such as a shelf above a radiator
- 10% bleach solution (prepared fresh) for decontamination and disposal
- Heavy-duty sealable plastic bags for final waste disposal
- Optional: low-power magnifying glass (10×) or dissecting microscope for close observation
- Optional: pH test strips to verify bread pH if comparing acidity treatments
- Optional: digital thermometer/hygrometer to monitor incubation conditions
Variables and controls
Getting the variable structure right is what separates a science experiment from a simple demonstration. Here is how to define each type for this experiment.
| Variable type | Definition | Example in this experiment |
|---|---|---|
| Independent variable | The one factor you deliberately change between groups | Temperature of incubation (e.g., 4 °C vs. 22 °C vs. 28 °C) |
| Dependent variable | What you measure to see the effect of your change | Percentage of bread surface covered by mold; number of visible colonies; colony diameter in mm |
| Controlled variables | Everything else kept identical across all groups | Bread type and brand, slice size, amount of added water (if any), bag type, incubation duration, observer |
| Positive control | A sample known to produce the result, confirming the experiment can work | Bread kept moist at room temperature in a sealed bag (should reliably grow mold) |
| Negative control | A sample expected to show no result, confirming contamination is not causing false positives | Bread sealed in a bag that has been briefly microwaved (kills spores) or a completely dry, frozen sample |
A common mistake is treating a sample with no deliberate treatment as the 'control' without thinking about what it is actually controlling for. Your positive control tells you the experiment is set up correctly. Your negative control tells you that any growth you see in experimental groups is real and not due to accidental contamination of your measurement process. Both are essential for a defensible conclusion.
Step-by-step experimental protocol
Preparation (Day 0)
- Put on gloves and eye protection before handling any bread that will be incubated.
- Prepare your labels: write the condition, date, sample number, and your name on each bag before placing bread inside.
- Cut or use pre-sliced bread so all samples are the same size (standard sandwich slices are fine; just keep them consistent).
- If your independent variable involves moisture, use the spray bottle to apply a defined number of sprays (e.g., 5 sprays per side) to experimental samples. Keep dry samples completely unsprayed.
- Immediately place each bread slice into a labeled, resealable bag. Seal the bag, pressing out most (but not all) of the air unless you are specifically testing an oxygen-free condition.
- Place each bag in its designated incubation location. Record the actual measured temperature at each location using a thermometer.
- Take a baseline photograph of every sample, placing a ruler next to the bag for scale. Record the date and time.
Incubation and timing
Incubate samples for a minimum of seven days and ideally up to fourteen days to capture the full growth curve including initial colonization, exponential spread, and possible plateau or sporulation phases. For a school week project, seven days is sufficient to see clear differences between most experimental conditions. Do not open the bags during the incubation period. All observations should be made through the transparent bag. This is important both for safety and for experimental integrity: opening bags releases spores into the classroom environment and introduces variables like additional oxygen or moisture.
Observation and data collection schedule
Observe and photograph each sealed sample every 24 hours if possible, or at minimum every 48 hours. On each observation, record the following through the sealed bag without opening it: the date and time, whether any visible growth is present (yes/no), the estimated percentage of bread surface covered by mold, the colors observed, the texture if visible (fluffy, powdery, flat), and any changes in bread color or structure outside the colony itself.
Observation schedule, photography, and microscopy
Photography is one of the most valuable data collection tools in this experiment because it gives you a permanent, timestamped record you can return to when writing your analysis. Set up a consistent photo station: place each bag flat on a plain white background, position a ruler along one edge of the bag, and photograph from directly above at the same distance each time. Consistent lighting matters: use the same light source (ideally a lamp rather than changing natural daylight) and turn off your camera flash if it creates glare on the plastic. Photograph every sample at every observation interval even if there is no visible change, because absence of growth is data too.
- Day 0: Baseline photos of all samples. Document bread color, texture, and any pre-existing marks.
- Day 1–2: First signs of growth often appear as faint white threads or small fuzzy patches. Note the location on the bread (edges, center, cut surfaces).
- Day 3–4: Colonies typically expand rapidly. Estimate percentage coverage using a transparent grid overlay on your photo, or by comparing to a reference (e.g., 25% = roughly one quarter of the slice).
- Day 5–7: Sporulation visible in many species. Rhizopus will show dark pinhead-sized sporangia; Penicillium will shift from white to blue-green powder. Note color changes carefully.
- Day 10–14 (extended): Colony maturation, potential secondary colonization, and substrate degradation visible.
For microscopy, if your classroom has a dissecting microscope (stereo microscope, 10–40× magnification), you can press a small piece of clear adhesive tape gently onto the outside surface of the bag over a colony to capture an impression of spore structures, then mount it on a glass slide. Alternatively, at the very end of the experiment during disposal, a teacher (wearing full PPE in a ventilated space) can open a completed bag, apply a tape-lift directly to the moldy surface, mount it in a drop of water on a microscope slide, and observe under a compound microscope at 40–100×. You should be able to see hyphae, sporangia in Rhizopus, and chains of conidia in Penicillium. Never open bags in the classroom without teacher supervision and a confirmed ventilated workspace.
Data collection templates
Use a table like the one below for each sample. Create one sheet per experimental group. Recording data in a structured template every day builds the dataset you need to draw a growth curve graph later.
| Day | Date/Time | Growth visible (Y/N) | % surface covered (estimated) | Colony color(s) | Colony texture | Notes / photo filename |
|---|---|---|---|---|---|---|
| 0 | ___ | N | 0% | N/A | N/A | Baseline photo taken |
| 1 | ___ | ___ | ___ | ___ | ___ | ___ |
| 2 | ___ | ___ | ___ | ___ | ___ | ___ |
| 3 | ___ | ___ | ___ | ___ | ___ | ___ |
| 4 | ___ | ___ | ___ | ___ | ___ | ___ |
| 5 | ___ | ___ | ___ | ___ | ___ | ___ |
| 6 | ___ | ___ | ___ | ___ | ___ | ___ |
| 7 | ___ | ___ | ___ | ___ | ___ | ___ |
If you have multiple colonies on one bread slice, record each colony separately if possible (Colony A, Colony B) and measure the diameter of each with a ruler through the bag. This gives you a quantitative measurement (colony diameter in mm) you can graph over time, which is more precise than percentage estimates alone.
Analyzing your data and what to expect
Once you have your data table filled in, plot a line graph with time (days) on the X-axis and your chosen growth metric (percentage coverage or colony diameter in mm) on the Y-axis. Plot each experimental condition as a separate line. A typical mold growth curve on moist bread at room temperature shows a lag phase of roughly 1–2 days (spores present but not yet visibly germinated), followed by a steep exponential growth phase from roughly day 2 to day 5, and then a plateau as the available substrate becomes saturated. Samples at cold temperatures should show a much flatter curve, while hot or dry conditions may show no growth at all.
For basic statistics, calculate the mean percentage coverage (or mean colony diameter) across replicate samples for each condition on each day, and note the range (highest minus lowest value). If your class has enough samples, a simple bar chart comparing mean coverage at day 7 across all conditions makes a clear visual for your conclusion section. Common expected results:
- Warm + moist samples (positive control): visible colonies by day 2, heavy coverage (>50%) by day 5–7.
- Cold (4 °C) samples: little to no visible growth after 7 days; possibly faint growth after 10–14 days.
- Dry samples (low moisture): significantly delayed or absent growth even at room temperature.
- Sealed vs. open: sealed moist samples often grow faster initially due to humidity retention; very tightly sealed low-oxygen bags may show slower growth than expected.
- Preservative bread vs. plain bread: plain white sandwich bread from a discount brand (less calcium propionate) typically molds faster than name-brand bread with listed preservatives.
If your results do not match expectations, that is scientifically interesting and worth discussing. Perhaps the room temperature fluctuated more than expected, or the bread you chose had undisclosed preservatives. Explaining discrepancies using the biology you have learned is exactly the kind of critical reasoning science teachers want to see in your conclusion.
Safety, allergies, mycotoxins, and disposal
This experiment uses naturally occurring, food-associated molds classified as Biosafety Level 1 (BSL-1) organisms, meaning they are not known to cause disease in healthy individuals under normal exposure. However, that does not mean careless handling is fine. Mold spores are potent allergens and respiratory irritants, and certain species such as Aspergillus flavus and Penicillium expansum can produce mycotoxins (aflatoxins and patulin, respectively) if growth is extensive. The American Society for Microbiology and public health guidance for school labs both emphasize that even BSL-1 work requires a pre-lab risk assessment, parental or guardian notification for younger students, and strict adherence to containment practices throughout.
- Always wear gloves and eye protection when handling incubated samples.
- Never open sealed bags in the classroom unless under direct teacher supervision in a well-ventilated space (ideally near an open window or in a fume hood).
- Students with known mold allergies, asthma, or immunocompromising conditions should not handle or closely observe open moldy samples.
- Do not smell the cultures deliberately. Mycotoxins are not produced in amounts dangerous from brief incidental exposure at BSL-1 scale, but inhaling spore clouds is unnecessary and preventable.
- Do not eat any bread used in the experiment, including control samples that appear mold-free.
- At the end of the experiment, prepare a fresh 10% bleach solution (1 part household bleach to 9 parts water).
- Without opening the bags, submerge sealed bags in the bleach solution for at least 30 minutes (chemical inactivation) or have the teacher autoclave bags if a school autoclave is available.
- After inactivation, double-bag the samples in heavy-duty sealable bags and dispose of in regular solid waste. Do not pour bleach-treated contents down the drain in large quantities without checking local regulations.
- Disinfect the lab bench and any surfaces the bags contacted with 70% ethanol or a 10% bleach wipe.
Troubleshooting common problems
Science projects rarely go perfectly on the first attempt, and that is a feature, not a failure. Here are the most common issues students encounter and how to address them systematically.
| Problem | Likely cause | How to fix or investigate |
|---|---|---|
| No growth on any sample after 5–7 days | Bread contains high levels of calcium propionate or other preservatives; room too cold or dry | Switch to a different bread brand with fewer listed preservatives, or slightly dampen the bread and re-seal. Check room temperature with a thermometer. |
| All samples grow equally regardless of experimental condition | Controlled variables were not actually controlled (e.g., moisture leaked between bags, temperature varied) | Add more replicates; re-check that bags are fully sealed; verify temperature at each location with a data-logging thermometer. |
| Growth appears only on one part of the bread (edges or cut surfaces) | Cut surfaces expose more starch and moisture, and may have been touched by hands (adding spore inoculum). This is normal biology. | Note this in observations; it is an interesting result. Consider this in your analysis: nutrient exposure and surface moisture vary across a slice. |
| Unexpected colors (pink, orange, black) that do not match expected species | Multiple species colonizing; possible contamination from the environment or handling | Record all colors carefully; accept multi-species colonization as a real-world result and discuss it in your conclusion. |
| Photos vary too much in lighting to compare | Inconsistent photo station setup | Create a simple photo box from a cardboard box with one open side, a white background, and a fixed lamp position. Always photograph from the same height. |
Experiment variations worth exploring
Once you have run the basic experiment, there are several compelling variations that deepen the scientific questions without adding significant cost or complexity. Each variation tests a different biological principle.
- Different bread types: Compare white sandwich bread, whole wheat, rye, sourdough, and gluten-free bread under identical conditions. Sourdough's low pH (around 3.8–4.5) should significantly delay mold compared to white bread. Whole-grain bread may support different species due to its more complex nutrient profile.
- Preservative comparison: Compare a generic store-brand white bread (check ingredients for calcium propionate) against an artisan loaf with no listed preservatives, and optionally a slice soaked briefly in a dilute potassium sorbate solution (~0.3%). Calcium propionate and sorbates inhibit mold at concentrations around 0.2–0.3% (w/w), which corresponds to roughly 2000–3000 ppm in commercial formulations.
- Humidity manipulation: Seal bread with 0, 5, or 10 sprays of water before closing the bag. Add a small damp piece of paper towel inside one bag (not touching the bread) to elevate humidity without wetting the bread directly.
- Sealed vs. open: Compare bread in a sealed bag versus bread on an open plate. This tests both oxygen availability and moisture retention simultaneously, so be sure to acknowledge in your analysis that it is testing two variables.
- Temperature gradient: Place samples in a refrigerator (~4 °C), a cool room (~18 °C), a warm room (~25 °C), and near a heat source (~35 °C). This gives you four data points for a temperature-response curve.
- Light vs. dark: Incubate identical moist samples in a dark cupboard versus a sunlit windowsill. Observe whether spore production (color intensity) differs even if coverage is similar.
Classroom extensions and assessment ideas
This experiment connects naturally to several middle- and high-school microbiology learning objectives and opens the door to broader discussions about food science, public health, and ecology. Below are curriculum-linked extensions that work well as follow-up assignments or enrichment activities.
- Food safety connection (grades 7–10): Research how the FDA's water activity guidelines (aw thresholds for mold growth) inform food labeling and packaging regulations. Connect your experimental results to why commercially packaged bread includes modified-atmosphere packaging or desiccant packets.
- Mycotoxin research assignment (grades 9–12): Investigate the mycotoxins produced by Aspergillus and Penicillium species (aflatoxins, ochratoxin A, patulin). WHO/JECFA and EFSA have established regulatory limits and provisional tolerable weekly intakes for these compounds. Students can write a risk communication brief explaining these hazards to a general audience.
- Comparative microbiology essay (grades 8–12): Compare fungal growth conditions (as observed in this experiment) with bacterial growth conditions, drawing on the distinct cell biology of each group. How does the presence of chitin versus peptidoglycan affect susceptibility to different preservation strategies?
- Design a commercial packaging strategy (grades 9–12, STEM challenge): Using the experimental data, ask students to design a food packaging solution for a school cafeteria that maximizes bread shelf life without refrigeration. Students must justify each design choice with data from the experiment and external research.
- Graphing and statistics skills (all grades): Calculate mean, range, and if appropriate for older students, standard deviation of colony measurements across replicates. Compare data between groups and discuss statistical significance informally (are the differences large enough to be convincing or could they be due to natural variation?).
- Scientific writing practice: Have students write a formal lab report with abstract, introduction (including background on fungal biology), methods, results, discussion, and conclusion sections. Peer-review each other's discussion sections for logical reasoning and correct use of evidence.
Suggested images and visuals for your report
Visual documentation makes your project report much more persuasive and is directly required for NGSS science and engineering practice 4 (analyzing and interpreting data). Include at least the following visual elements.
- Timeline photo grid: A grid layout showing one photograph per day for each experimental condition, arranged in columns (one per condition) and rows (one per day). This single image communicates your entire dataset visually.
- Schematic diagram of fungal life cycle: Draw or reproduce a labeled diagram showing the progression from spore to germ tube to hyphae to mycelium to reproductive structure (sporangium or conidiophore) and back to spore release. Label chitin-containing cell walls, hyphae, and mycelium.
- Spore and hyphae sketch from microscopy: If you used a dissecting or compound microscope, include a labeled sketch (or annotated photograph) showing hyphae branching patterns and spore structures. Note the magnification.
- Growth curve graph: A line graph showing percentage surface coverage (Y-axis) versus days of incubation (X-axis) with one line per experimental condition. Include error bars if you have replicate data.
- Data table: Your completed daily observation table, formatted cleanly with consistent units and column headers.
- Comparison bar chart: A bar chart showing mean mold coverage at the end of the incubation period for each experimental condition, making group comparisons immediately visual.
The bread mold science project is genuinely one of the most information-rich experiments available at the classroom level because mold growth visibly responds to so many different variables in a short time frame. Every fuzzy colony you observe is a real-time demonstration of principles that drive food safety, medical mycology, and environmental biology. The more carefully you control, measure, and question your observations, the more you will get out of it. Start simple with one variable, document everything, and let the data tell the story.
FAQ
What is bread mold and how is it different from bacteria?
Bread mold refers to filamentous fungi that grow on bread surfaces; common genera include Rhizopus, Penicillium, and Aspergillus. Fungi are eukaryotic (have a nucleus and organelles) and grow as hyphae (thread‑like filaments) forming a mycelium, while bacteria are prokaryotic and unicellular. Fungal cell walls contain chitin (not peptidoglycan), they absorb nutrients through the cell wall, and reproduce by producing spores (asexual and/or sexual). Visible ‘mold’ colonies are made of dense hyphae and spores rather than individual bacterial cells.
What is the life cycle of bread‑spoiling molds in simple terms?
Spores land on a moist nutrient surface (bread), germinate to form a germ tube, extend hyphae that branch and form a mycelium, and then produce reproductive structures that release new spores. Under suitable conditions this sequence (spore → germination → hyphal growth → sporulation) can produce visible colonies in a few days.
Which mold species commonly grow on bread and what do they look like?
Common genera: Rhizopus (fast, cottony/black sporangia — often called black bread mold); Penicillium (powdery/velvety blue‑green colonies with brush‑like conidiophores); Aspergillus (varied colors, sometimes black or yellow, often powdery). Colony color, texture, and growth rate vary by genus and strain and are useful clues but not definitive identification without microscopy or further tests.
What environmental factors control mold growth on bread?
Key factors: temperature (most bread molds grow best around 20–30 °C but ranges vary by species); moisture/water activity (higher water activity favors faster growth; typical bread a_w supports many common molds); oxygen (molds are generally aerobic — low O2 slows growth); pH (many molds prefer mildly acidic to neutral conditions typical of bread); nutrients (starch, sugars, enzymes in bread provide substrate); light (can influence sporulation and pigmentation in species‑specific ways). Altering any of these can slow, stop, or change visible growth and sporulation.
How do preservatives and packaging affect mold on bread?
Weak‑acid preservatives used in commercial bread (calcium propionate, sorbates) inhibit many molds at typical formulation levels (~0.2–0.3% w/w). Modified‑atmosphere packaging (reduced O2, elevated CO2) also slows mold growth. However, effectiveness depends on concentration, strain tolerance, and storage conditions; some Aspergillus species tolerate lower water activity and higher temperatures than others.
How can I design a safe, standards‑aligned classroom experiment to show mold growth on bread?
Design outline: state learning objectives and perform a risk assessment. Use BSL‑1 classroom practices (adult supervision, PPE, sealed incubations). Choose simple question(s), e.g., “How do humidity and preservatives affect the time to first visible mold on bread?” Select independent variable(s), dependent variable (time to visible mold, percent surface coverage), and controlled variables (same bread type, slice size, incubation temperature). Include negative controls (sterile bread handling, or bread with confirmed preservative) and document methods so results are reproducible. Plan inactivation and disposal (validated bleach soak or autoclave) and notify parents/administration if required by school policy.